This piece marks the first in our series on predictive coding. Bruce Fein – who is a pioneer in the field of predictive coding – starts the series by exploring some of the fundamental concepts needed to understand and leverage predictive coding in the preparation of a matter. Given his area of expertise, Bruce has focused this piece on the technical definitions and use of error rate, recall, and precision to meet requirements under Federal Rules of Civil Procedure. We’ll continue the discussion about how to define and explain terms with a lawyer’s perspective on accuracy measurements, from Meribeth Banaschik, Attorney at Law and Solicitor of England and Wales, at Noerr LLP.
So, how do we define basic accuracy measurements for predictive coding from a technical perspective? Read on to find out.
A party who has decided to use, or consented to, an adversary’s use of predictive coding in connection with a document production must measure the accuracy of the predictive-coding output, in order to assess sufficiency and defensibility under the Federal Rules of Civil Procedure or other applicable discovery rules. The intuitive accuracy measurement, error rate (the proportion of correct relevancy decisions), can be highly misleading. Better metrics are recall, which measures the proportion of relevant (or “responsive”) documents included in the production, and precision, which measures non-relevant (or “non-responsive”) documents erroneously included.
To illustrate each of these metrics, imagine that you are advising your client in connection with its response to a request for production. You jointly identify fifty custodians who may have relevant materials, from whose files the client gathers and provides you with one million electronic documents, filtered to the appropriate date range. Five percent, or 50,000, of these documents are responsive, though you do not know that at the outset. Because of the large volume of documents, rather than incur the time and expense of having them all reviewed by attorneys, you consider using predictive coding to assist the review. Working with a predictive-coding vendor, your attorneys review documents to train the predictive-coding software, which in turn categorizes all one million documents as responsive or non-responsive. By what metrics can you measure and defend the accuracy of your production?
error rate: Fool’s Gold
A basic, but (as will be seen) inadequate, accuracy measurement is error rate, or what percent of all relevancy decisions made by the software were correct? It has the appeal of simplicity. But the nature of document review limits the utility of this definition, particularly when dealing with low “prevalence” or “density” (a collection of which a small proportion is responsive). In our hypothetical, imagine that your predictive-coding vendor identified all documents as non-responsive, yielding an error rate of 5% and “accuracy” of an impressive-sounding 95% despite having missed all fifty thousand relevant documents. If the software correctly identified 25,000 responsive documents and marked the remaining 975,000 documents as non-responsive, the error rate would be 2.5%, and accuracy 97.5%, despite finding only half of the relevant documents. Litigants could artificially deflate the error rate and inflate “accuracy” by adding voluminous documents known to be non-responsive: Suppose, in our hypothetical, that the client gathers, in addition to the one million documents containing the potentially relevant materials, nineteen million documents from custodians who could not have relevant documents, or from beyond the relevant date range. Again the predictive-coding software codes all documents as non-responsive, for an even more impressive-sounding accuracy rate of 99.75% (error rate of 0.25%), yet it found not a single relevant document. We need a measure to tell us how many of the relevant documents we found.
recall: What Proportion of Relevant Documents Were Produced?
That measurement that tells us how many relevant documents we found is recall: the percentage of responsive documents that were identified as such. It measures completeness, that is, what proportion of the responsive documents were identified. recall also indirectly measures the number of documents that should have been marked for production but were not: however short recall falls of 100% is the proportion of responsive documents that the predictive-coding failed to identify as such. To illustrate, suppose that in our hypothetical, the predictive-coding software identifies 40,000 of the 50,000 responsive documents as responsive, and mis-identifies the remaining 25,000 as non-responsive. (Set aside for now the 950,000 non-responsive documents, which we will discuss in connection with precision). recall is then 80% (40,000 responsive documents found out of 50,000 that exist). Thinking of recall as it relates to false negatives, 80% recall implies a false-negative rate of 20% (the proportion of responsive documents incorrectly marked as non-responsive).
But what of the 950,000 non-responsive documents? Most or all of them must be weeded out. To see why, imagine in our hypothetical that the predictive-coding software marked all one million documents are relevant. You would have recall of 100%, because the software would have correctly marked all 50,000 responsive documents as responsive. But it would also have marked as responsive the 950,000 non-responsive documents, leaving you with a vastly over-inclusive production set, evidence unnecessarily in the hands of your adversary, and too many documents to review. predictive coding would have added no value at all.
precision: What Proportion of Documents Produced Were Relevant?
To measure the extraneous non-responsive matter that has been incorrectly categorized as responsive, use precision: the percentage of documents identified as belonging to a category that actually belong. It measures over-inclusiveness: what proportion of the documents identified as responsive actually were responsive? precision can also be thought of in terms of false positives: the complement of precision is the percentage of extraneous (non-responsive, non-privileged, etc.) documents erroneously identified as belonging to a category. In other words, precision measures the number of documents that should not have been marked for production, but were. Imagine in our production that the predictive-coding software categorized 55,000 documents as responsive: 45,000 that were responsive and 10,000 non-responsive. recall would be 90% (50,000 found out of 55,000 that exist), and precision would be 82%: 45,000 documents actually responsive out of the 55,000 total documents marked as responsive. Contrast that measurement with the 5% precision in the preceding paragraph’s hypothetical, in which 950,000 out of 1,000,000 documents marked as relevant actually were.
In practice, 90% recall and 70% or greater precision make for a notably accurate production. Human recall is typically far lower than 90%,[1] and any party who has been buried in an opponent’s irrelevant documents can appreciate the value of 70% precision. As explained below, precision will often approach 100%. recall of 75% has been approved by two courts.[2]
In general, recall and precision can be traded off: a higher recall can be achieved at the expense of lower precision, and vice versa. Because firms often set a higher recall goal for privilege than for responsiveness, predictively coded precision is usually lower for privilege than for responsiveness. This should not result in over-withholding, because in generating the privilege log any non-privileged documents can be injected back into the production, theoretically yielding a privilege precision of 100%.
Similarly, a producing party often attorney-reviews all documents identified as responsive by the predictive-coding software before producing. In this case, too, precision will theoretically reach 100%, as review attorneys discard all non-responsive documents from the production.
recall and precision can be measured through statistical sampling of a few hundred to a few thousand documents, depending on prevalence.
Figures 1 and 2 illustrate recall and precision. Each figure assumes a collection of 1 million documents: 50,000 responsive and 950,000 non-responsive. Each document icon represents 10,000 documents: green for responsive, red for non-responsive.
Figure 1
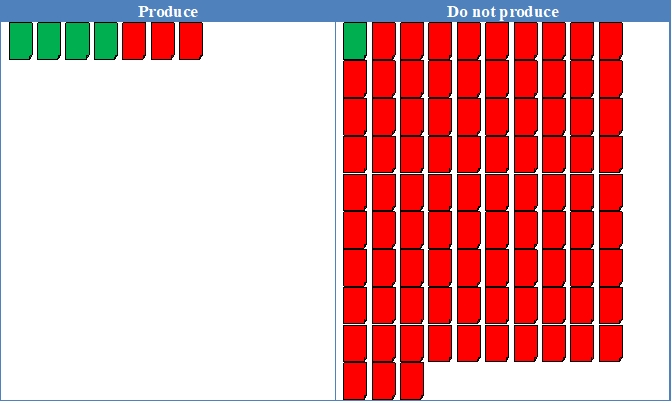
recall is 80%: 40,000 of the 50,000 responsive documents were produced.
precision is 57%: 30,000 non-responsive documents were produced along with the 40,000 responsive documents, so 40,000 were responsive out of 70,000 total documents produced, or 57%.
Figure 2
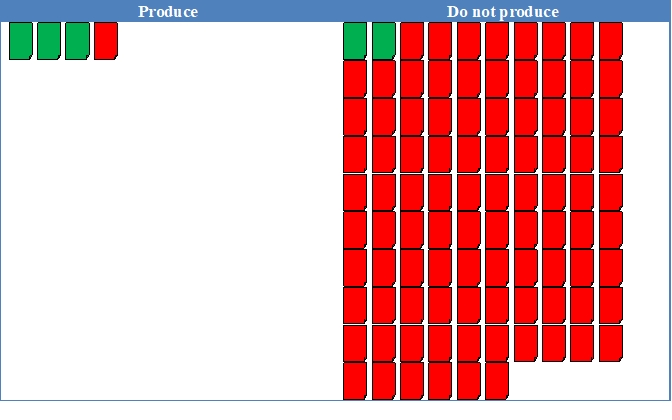
recall is 60%: 30,000 of 50,000 responsive documents were produced.
precision is 75%: 10,000 non-responsive documents were produced along with the 30,000 responsive documents, so 30,000 were responsive out of 40,000 total documents produced, or 75%.
Footnotes
[1] See, e.g., David C. Blair & M.E. Maron, An Evaluation of Retrieval Effectiveness for a Full-Text Document-Retrieval System, 28 Comm. ACM 289 (1985).
[2] See In re Biomet, No. 3:12-MD-2391 (N.D. Ind. April 18, 2013) and Global Aerospace, Inc. v. Landow Aviation, L.P., No. CL 61040 (Loudoun County, Va. Circuit Court April 23, 2012).